What is Addition Table?
An addition table, also known as an addition chart or addition grid, is a visual representation of the results of adding two numbers together. It is a useful tool for learning and practicing addition. The table typically lists numbers in rows and columns, and the cell at the intersection of a specific row and column contains the sum of the two numbers corresponding to that row and column.
For example, in a simple addition table for numbers 0 to 9, the cell at the intersection of row 3 and column 4 would contain the sum 7 because 3 + 4 equals 7.
Addition tables are often used in early education to help students understand and memorize addition facts and improve their arithmetic skills. They provide a structured way to visualize and learn basic addition operations.
As students progress in their math education, they move beyond addition tables to more complex mathematical concepts, but addition tables remain a fundamental tool for building a strong foundation in arithmetic.
Addition Table
Here is an addition table that shows the results of adding numbers from 1 to 10 to each other:
| + |
1 |
2 |
3 |
4 |
5 |
6 |
7 |
8 |
9 |
10 |
| 1 |
2 |
3 |
4 |
5 |
6 |
7 |
8 |
9 |
10 |
11 |
| 2 |
3 |
4 |
5 |
6 |
7 |
8 |
9 |
10 |
11 |
12 |
| 3 |
4 |
5 |
6 |
7 |
8 |
9 |
10 |
11 |
12 |
13 |
| 4 |
5 |
6 |
7 |
8 |
9 |
10 |
11 |
12 |
13 |
14 |
| 5 |
6 |
7 |
8 |
9 |
10 |
11 |
12 |
13 |
14 |
15 |
| 6 |
7 |
8 |
9 |
10 |
11 |
12 |
13 |
14 |
15 |
16 |
| 7 |
8 |
9 |
10 |
11 |
12 |
13 |
14 |
15 |
16 |
17 |
| 8 |
9 |
10 |
11 |
12 |
13 |
14 |
15 |
16 |
17 |
18 |
| 9 |
10 |
11 |
12 |
13 |
14 |
15 |
16 |
17 |
18 |
19 |
| 10 |
11 |
12 |
13 |
14 |
15 |
16 |
17 |
18 |
19 |
20 |
Here are addition tables individually for all the numbers from 1 to 10:
Addition Table for 1:
Addition Table for 2:
Addition Table for 3:
Addition Table for 4:
Addition Table for 5:
Addition Table for 6:
| + |
1 |
2 |
3 |
4 |
5 |
6 |
| 6 |
7 |
8 |
9 |
10 |
11 |
12 |
Addition Table for 7:
| + |
1 |
2 |
3 |
4 |
5 |
6 |
7 |
| 7 |
8 |
9 |
10 |
11 |
12 |
13 |
14 |
Addition Table for 8:
| + |
1 |
2 |
3 |
4 |
5 |
6 |
7 |
8 |
| 8 |
9 |
10 |
11 |
12 |
13 |
14 |
15 |
16 |
Addition Table for 9:
| + |
1 |
2 |
3 |
4 |
5 |
6 |
7 |
8 |
9 |
| 9 |
10 |
11 |
12 |
13 |
14 |
15 |
16 |
17 |
18 |
Addition Table for 10:
| + |
1 |
2 |
3 |
4 |
5 |
6 |
7 |
8 |
9 |
10 |
| 10 |
11 |
12 |
13 |
14 |
15 |
16 |
17 |
18 |
19 |
20 |
Addition Table Examples
Example 1: Find all the elements of row 5 in the addition table 1 – 10.
To find all the elements of row 6 in the addition table from 1 to 10, we just need to look at the row labeled “6” and read the values in each column.
Here is the addition table for 1-10 with row 6 highlighted:
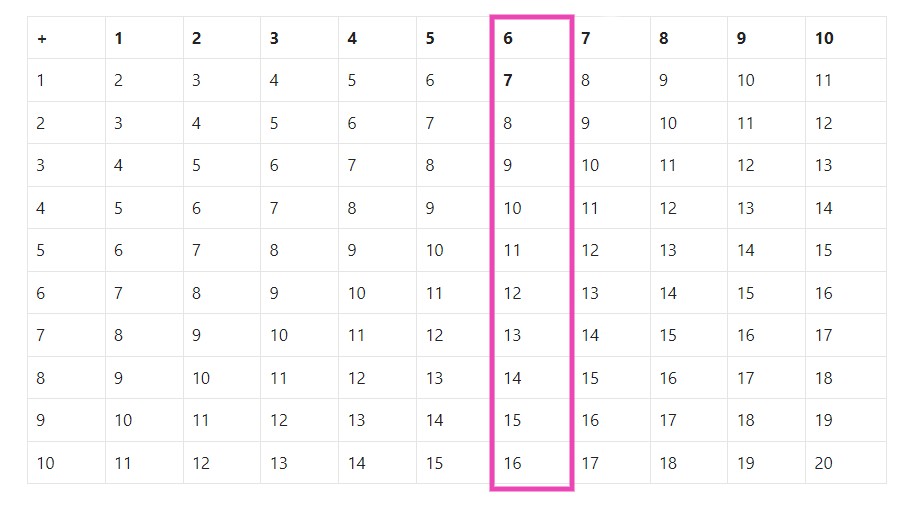
The elements of row 6 are 7, 8, 9, 10, 11, 12, 13, 14, 15, and 16.
Example 2:Addition Table for Numbers 1 to 5
| + |
1 |
2 |
3 |
4 |
5 |
| 1 |
2 |
3 |
4 |
5 |
6 |
| 2 |
3 |
4 |
5 |
6 |
7 |
| 3 |
4 |
5 |
6 |
7 |
8 |
| 4 |
5 |
6 |
7 |
8 |
9 |
| 5 |
6 |
7 |
8 |
9 |
10 |
Example 3: Addition Table for Numbers 6 to 10
| + |
6 |
7 |
8 |
9 |
10 |
| 6 |
12 |
13 |
14 |
15 |
16 |
| 7 |
13 |
14 |
15 |
16 |
17 |
| 8 |
14 |
15 |
16 |
17 |
18 |
| 9 |
15 |
16 |
17 |
18 |
19 |
| 10 |
16 |
17 |
18 |
19 |
20 |
Example 4: Addition Table for Numbers 11 to 15
| + |
11 |
12 |
13 |
14 |
15 |
| 11 |
22 |
23 |
24 |
25 |
26 |
| 12 |
23 |
24 |
25 |
26 |
27 |
| 13 |
24 |
25 |
26 |
27 |
28 |
| 14 |
25 |
26 |
27 |
28 |
29 |
| 15 |
26 |
27 |
28 |
29 |
30 |
Example 5: Addition Table for Numbers 16 to 20
| + |
16 |
17 |
18 |
19 |
20 |
| 16 |
32 |
33 |
34 |
35 |
36 |
| 17 |
33 |
34 |
35 |
36 |
37 |
| 18 |
34 |
35 |
36 |
37 |
38 |
| 19 |
35 |
36 |
37 |
38 |
39 |
| 20 |
36 |
37 |
38 |
39 |
40 |
Example 6:Addition Table for Numbers 21 to 25
| + |
21 |
22 |
23 |
24 |
25 |
| 21 |
42 |
43 |
44 |
45 |
46 |
| 22 |
43 |
44 |
45 |
46 |
47 |
| 23 |
44 |
45 |
46 |
47 |
48 |
| 24 |
45 |
46 |
47 |
48 |
49 |
| 25 |
46 |
47 |
48 |
49 |
50 |
Example 7:Addition Table for Numbers 26 to 30
| + |
26 |
27 |
28 |
29 |
30 |
| 26 |
52 |
53 |
54 |
55 |
56 |
| 27 |
53 |
54 |
55 |
56 |
57 |
| 28 |
54 |
55 |
56 |
57 |
58 |
| 29 |
55 |
56 |
57 |
58 |
59 |
| 30 |
56 |
57 |
58 |
59 |
60 |
Example 8: Addition Table for Numbers 31 to 35
| + |
31 |
32 |
33 |
34 |
35 |
| 31 |
62 |
63 |
64 |
65 |
66 |
| 32 |
63 |
64 |
65 |
66 |
67 |
| 33 |
64 |
65 |
66 |
67 |
68 |
| 34 |
65 |
66 |
67 |
68 |
69 |
| 35 |
66 |
67 |
68 |
69 |
70 |