Bar Graphs in Mathematics
Bar graphs are a popular way to represent data visually. They provide a quick and easy way to compare information across different categories. In this article, we’ll explain what bar graphs are, how they work, and how to create them.
What are Bar Graphs?
A bar graph, also known as a bar chart, is a visual representation of data that uses rectangular bars to compare values between different categories. Each bar represents a category, and the height or length of the bar corresponds to the value or frequency of that category.
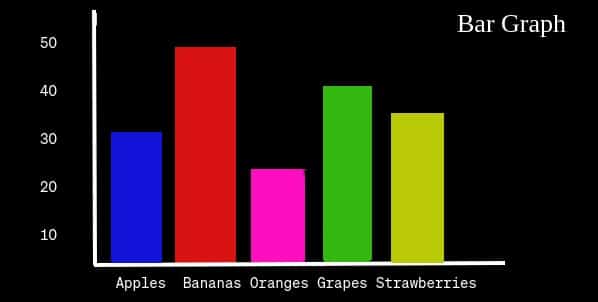
For example, Suppose you conducted a survey asking people about their favorite fruits, and you want to represent the data using a bar graph. Here are the results:
| Fruit | Apples | Bananas | Oranges | Grapes | Strawberries |
|---|---|---|---|---|---|
| Number of Votes | 30 | 47 | 22 | 40 | 35 |
Now, let’s create a bar graph to visualize this data:
Types of Bar Graphs
Bar Graphs are essentially divided into two varieties:
- Vertical Bar Graph
- Horizontal Bar Graph
The bars in bar graphs can be considered horizontally or vertically. The vertical bar graph is the most used bar graph when we graphical display of data.
Vertical Bar Graphs
Vertical bar graphs are the most common type of bar graph. They use vertical bars to represent the data, with the height of each bar corresponding to the value or frequency of the category it represents. The categories are displayed along the x-axis, while the values or frequencies are displayed along the y-axis.
Horizontal Bar Graphs
Horizontal bar graphs use horizontal bars to represent the data, with the length of each bar corresponding to the value or frequency of the category it represents. The categories are displayed along the y-axis, while the values or frequencies are displayed along the x-axis.
Stacked Bar Graphs
Stacked bar graphs are used to show how a total is divided into different categories. They use vertical or horizontal bars to represent the data, with each bar divided into segments that represent the different categories. The height or length of the bar corresponds to the total value, while the segments represent the individual values or frequencies of each category. Stacked bar graphs are useful for displaying data where the total value is significant.
Grouped Bar Graphs
Grouped bar graphs are used to compare values between different categories and subcategories. They use vertical or horizontal bars to represent the data, with each bar representing a category and each segment within the bar representing a subcategory. Grouped bar graphs are useful for displaying data where there are multiple subcategories within each category.
How to Draw a Bar Graph?
Here are given below how to draw a bar graph:
Step 1: Determine Your Categories
Step 2: Collect Your Data
Step 3: Determine Your Scale
Step 4: Draw Your Axes
Step 5: Draw Your Bars
Step 6: Label Your Bars
Step 7: Add Details
Step 8: Review and Revise
Frequently Asked Questions on Bar Graph
Q: What is a bar graph?
A: A bar graph is a type of chart that displays data using rectangular bars. The height or length of each bar represents the value or frequency of a category, and the bars are typically arranged in order along the x-axis.
Q: What are bar graphs used for?
A: Bar graphs are commonly used to visually represent data in a way that is easy to understand. They can be used to display information about categories such as sales, population, or any other numerical or categorical data.
Q: What are the different types of bar graphs?
A: There are several types of bar graphs, including vertical bar graphs, horizontal bar graphs, stacked bar graphs, and clustered bar graphs. Each type has its own unique features and is used for different purposes.
Q: What are the advantages of using a bar graph?
A: Bar graphs are an effective way to visually represent data, making it easy to see trends and compare values. They are simple to create and understand, making them a useful tool for communicating information to a wide audience.