What is Pictograph?
A Pictograph is a graphical representation of data using images. Each image or icon in the pictograph draws a specific number of things.
Pictograph Example : Orange Sold
Lets make a pictograph of how many oranges were sold the showroom over 4 months:
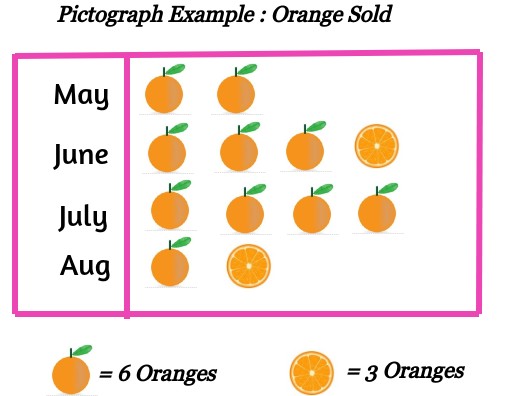
Note that each picture of orange means 6 oranges (and the half-orange picture means 3 oranges).
So the pictograph is describing data as:
- In May 12 oranges were sold
- And In June 21 oranges were sold
- In July 24 oranges were sold
- In Aug 9 oranges were sold
It is a simple and interesting method to display data.
But it is not very reliable: in the example, before we can’t explain just 1 orange sold, or 2 oranges sold, etc.